Past performance is not a guarantee of future returns. The money invested in the fund may both increase and decrease in value, and it is not certain that you will recover the entire amount invested.

Read more here.
Floating dollar bills over a tunnel of binary code, symbolizing digital money and online financial transactions.

November monthly letter | “Artificial Money”

Elements is AuAg's monthly letter highlighting macroeconomic observations from the previous month. Our focus is on events that impact the investment environment for gold, silver and other essential metals. These observations are presented with images and charts laid out efficiently and concisely.

Au and Ag in the past month
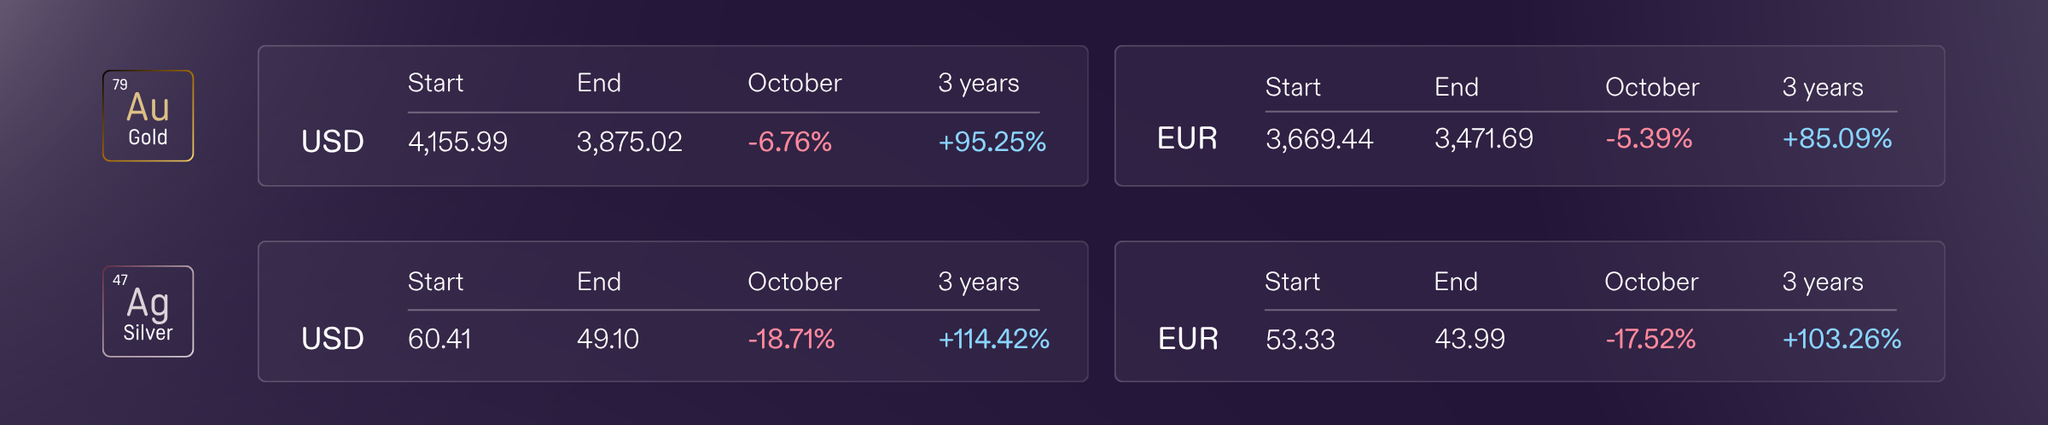
Gold and silver fell sharply over the last ten days of October, leaving gold with one of its toughest months in modern times. Continued expectations of rate hikes have created a situation where the market reads them as bad news for gold, even though gold has risen through every recent hiking cycle. The mantra runs deep, and positioning has turned the move into a self-fulfilling prophecy. We also note that the dollar is once again heavily overbought.
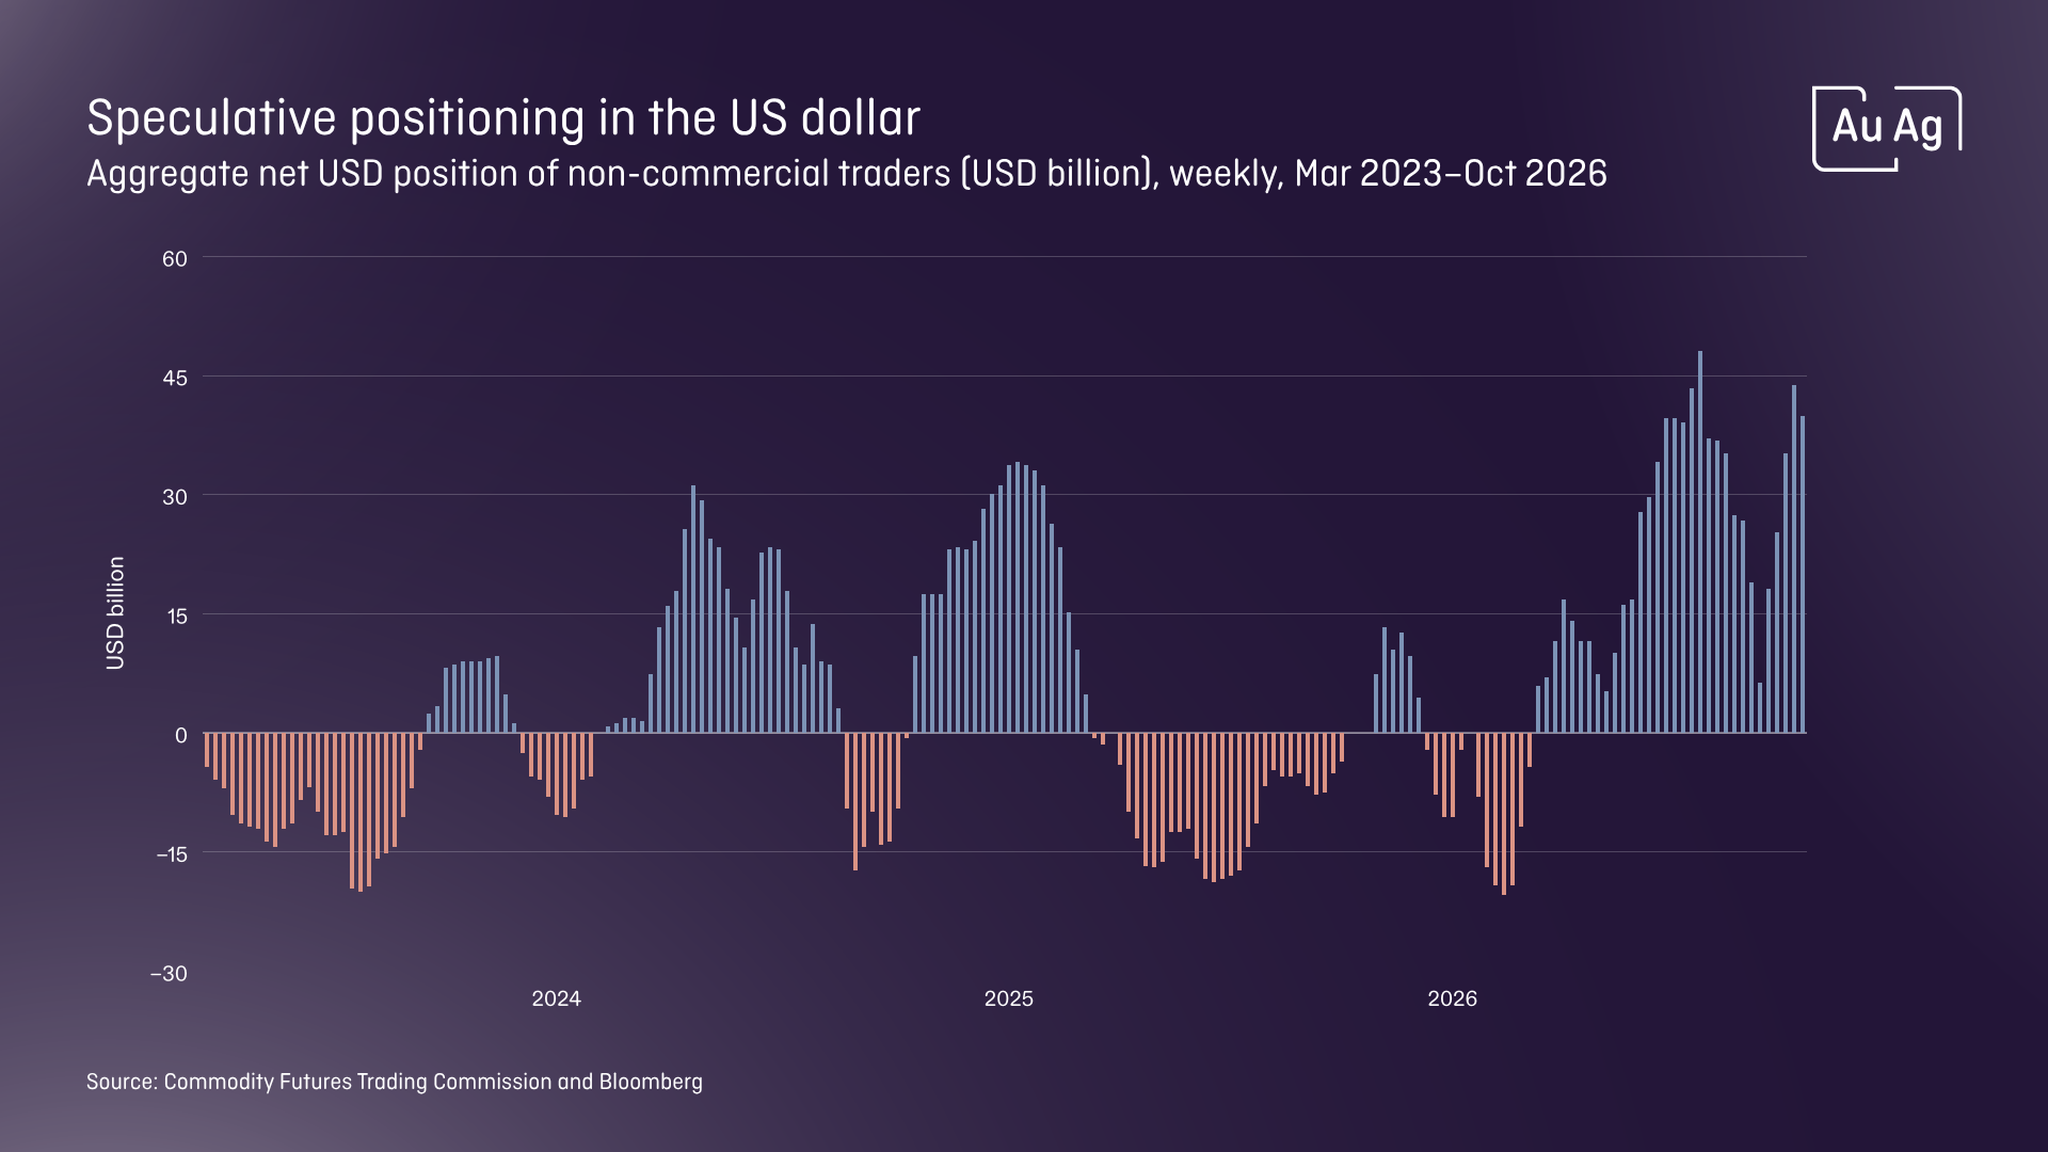
Bar chart of weekly speculative net USD positions, showing swings from negative in 2023–25 to strong positive levels by late 2026.

Naturally, players such as Bear Stearns in the past, JPMorgan and now Jane Street will use COMEX for their business. But now that the commercials’ net short position (the light bars below zero in the chart below) has shrunk – especially if you dig deeper into how the different categories of traders are positioned – it looks as though this round is over and the market is primed for a move higher.
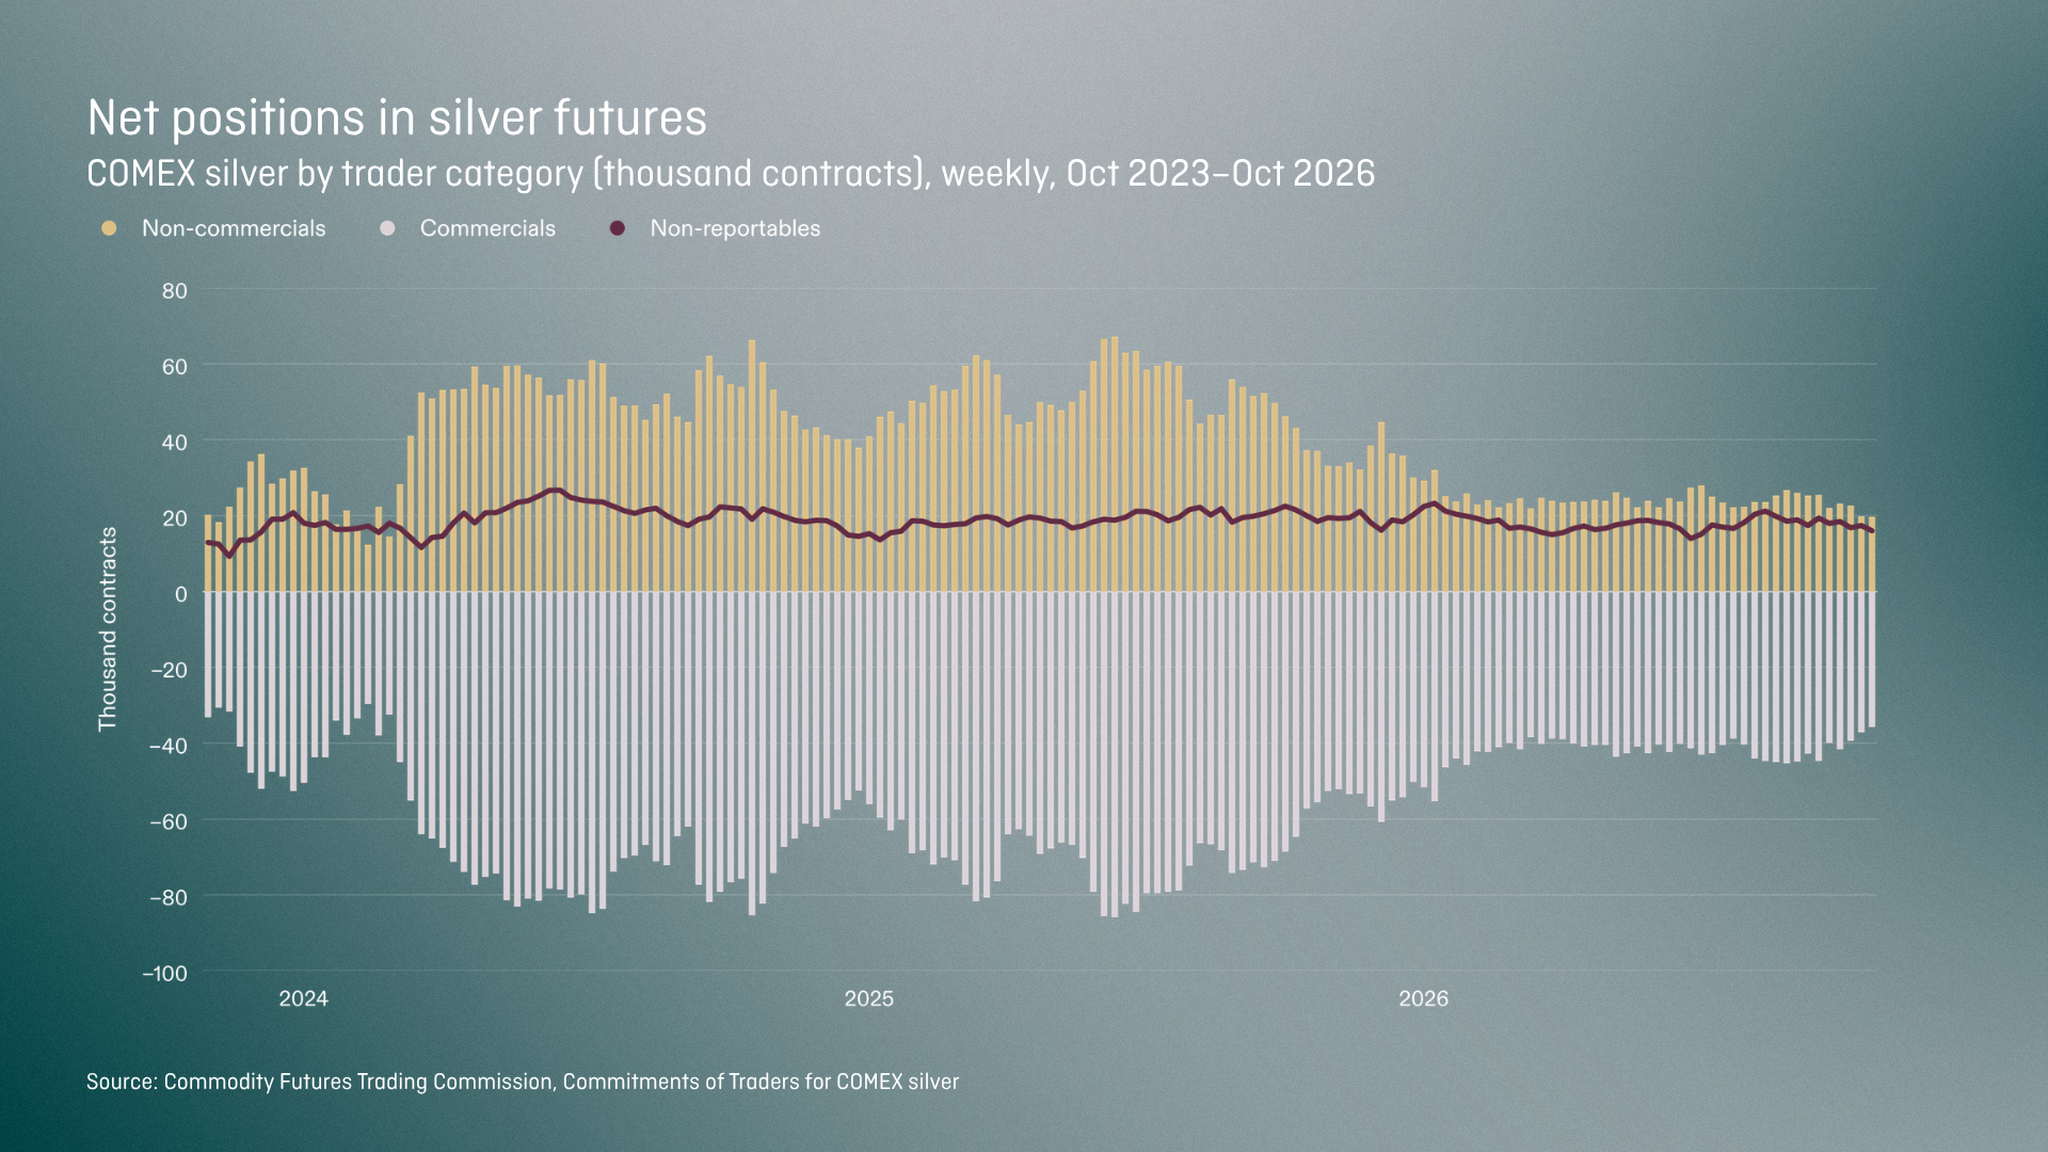
Chart of COMEX silver futures net positions by trader type, showing rising non-commercial longs and deepening commercial shorts from 2023–2026.

The month’s fall in the gold price is remarkable. We are also seeing record gold exports from the US, as the chart below shows. Among other things, there are signs that countries have wanted to bring home the gold reserves they hold in the US. Rather than ship the gold, they have sold it quickly and then bought it back slowly at home at lower prices. That way they have been able both to move their gold and to profit from the transaction.

We also speculate that gold that came under US control after the wars in Iraq, Libya, Ukraine, and now, above all, Venezuela – has not gone into the US’s own reserve, but that parts of it have been sold to cover some of the enormous cost of those wars. The East is buying with open arms, and none of this changes the long game.
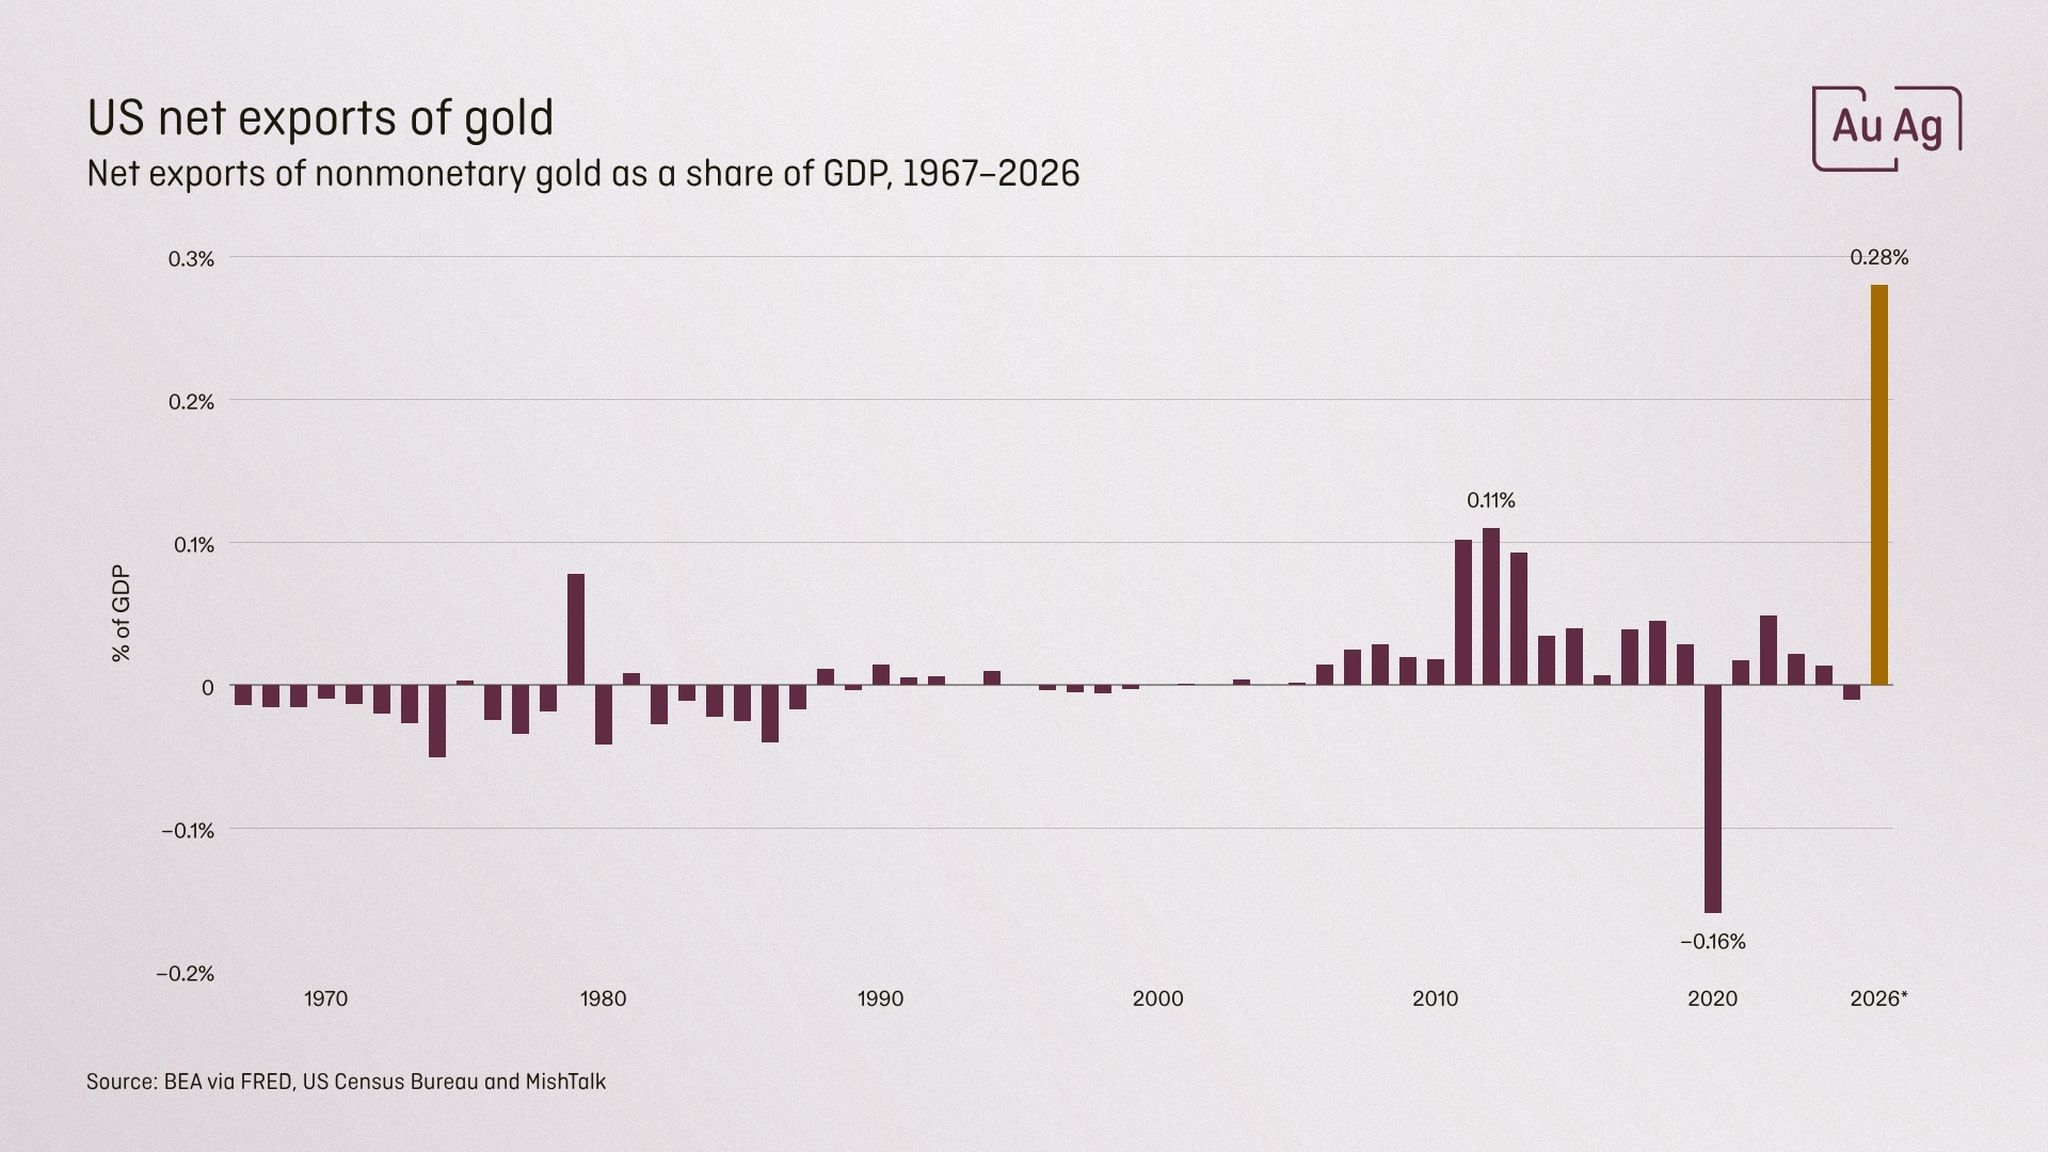
Bar chart of US net exports of nonmonetary gold as % of GDP from 1967–2026, showing small bars with a deep dip in 2020 and a big spike in 2026.

One factor that drives the gold price is central bank buying, and over the past quarter central banks have bought gold in record amounts, as the chart below shows. At AuAg, we have long stressed the importance of watching what central banks do, rather than taking what they say on blind faith.
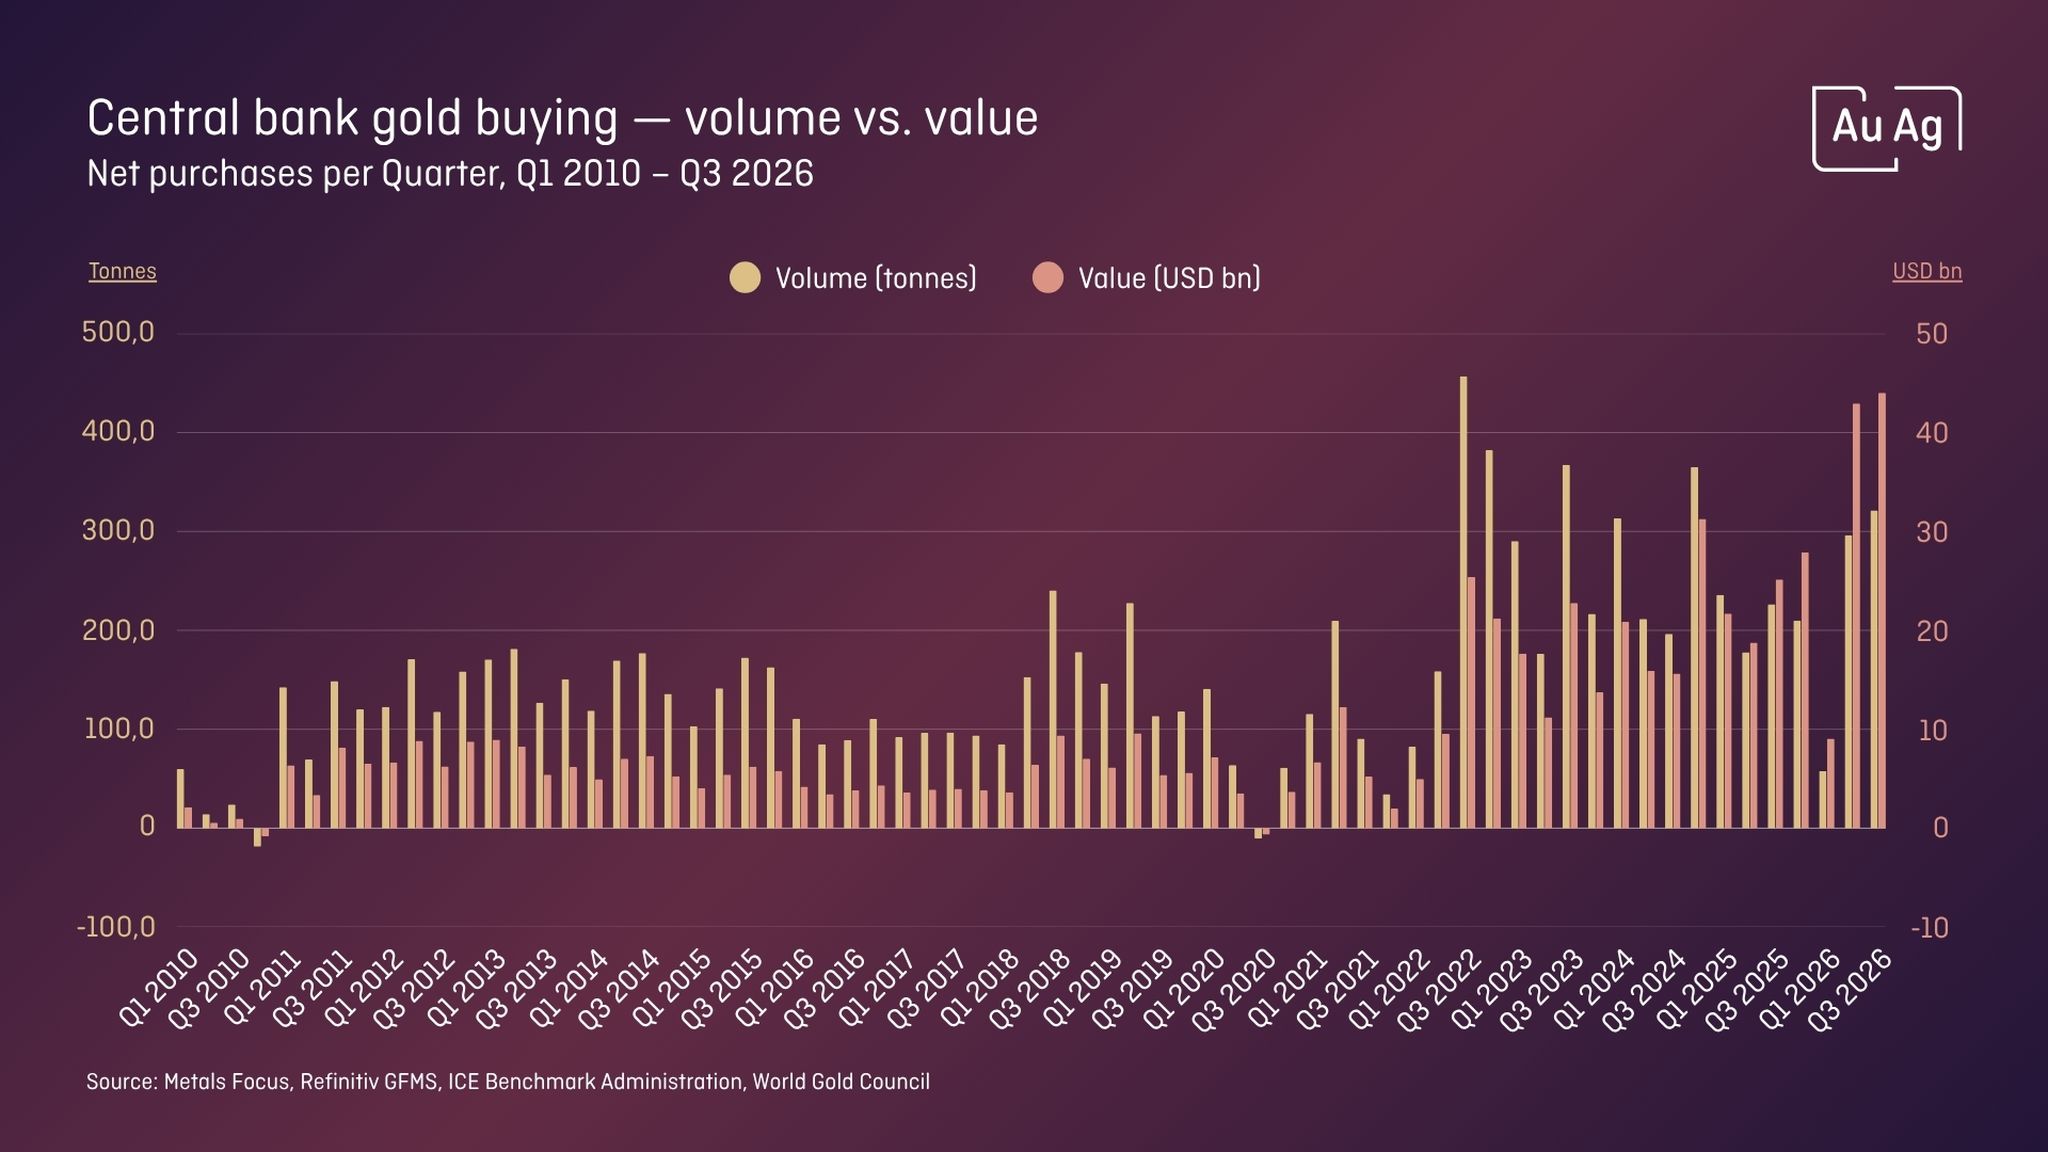
Bar chart of central bank gold buying per quarter 2010–2026, showing rising volume and value, with sharp peaks after 2020.

One thing that would speed up gold’s future gains is if the US realised that its best option (as long as it holds the most gold) may be to start announcing large gold purchases. Its large gold reserves would make its debt situation look better, and we would see a gold price that could quickly go 2, 3, 4 or 5x.

As for the sharp swings, we will see many spikes over the next 5, 10 and 20 years. We have seen silver rise to 120 and then fall back to 50. Going forward, we will also see silver at 300, followed by periods where it builds a base around 100. That is what the journey will look like – you can simply ride it out, or make use of the swings. 

Metals like silver are volatile. They react to momentum, to speculation, to manipulation and to having been artificially suppressed for a long time. But they also react to physical industrial shortages, which can lead to gains that are both large and rapid.

Historical price charts tell you very little and only confirm movement patterns as they play out. Add to that the fact that past rallies and corrections will barely register on the price chart when we look back a few years from now.

At the core, we have a demand for the world's "best" metal when it comes to electrical and thermal conductivity. A metal that also has served as the world currency for longer periods than any fiat currency, or perhaps even gold.

The core case is that the dollar has lost 90%, and then 90% again, measured in gold. It will again lose 90% and then 90% anew – offering multiplying returns. Add to that our high-tech world, which will precisely be built on high-tech metals, such as silver. Only small amounts go into each product, yet they provide an utterly essential function, making demand price-inelastic.
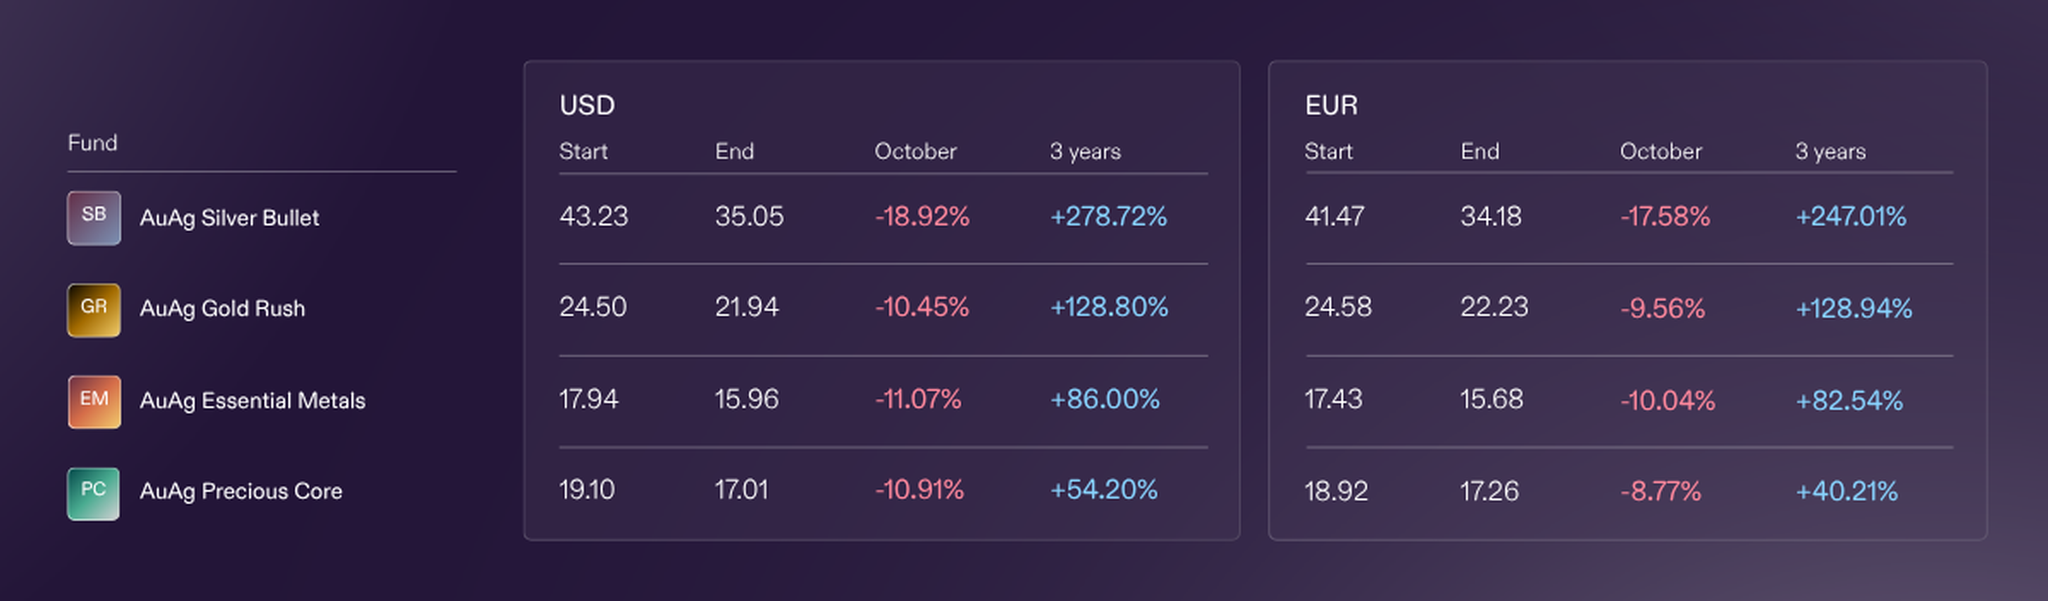
The AuAg funds - Highlights

We note that the companies outperformed the commodity during last year’s rallies, and again this year in months such as January and August. At the same time, the companies have shown no real leverage on the downside during this year’s weaker months (and especially not on the days of large single-day falls).

That the funds outperformed the commodity last year, returning +104.3% and +163.7%, was perhaps not so surprising. But outperforming it over the first ten months of this year is a sign of strength.

AuAg Gold Rush YTD -4.3%, gold YTD -6.1% (EUR)

AuAg Silver Bullet YTD -12.7%, silver YTD -32.4% (EUR)

We are now hoping for renewed strength that brings a few more “August-like” months, so that we can close out 2026 on a strong note as well.

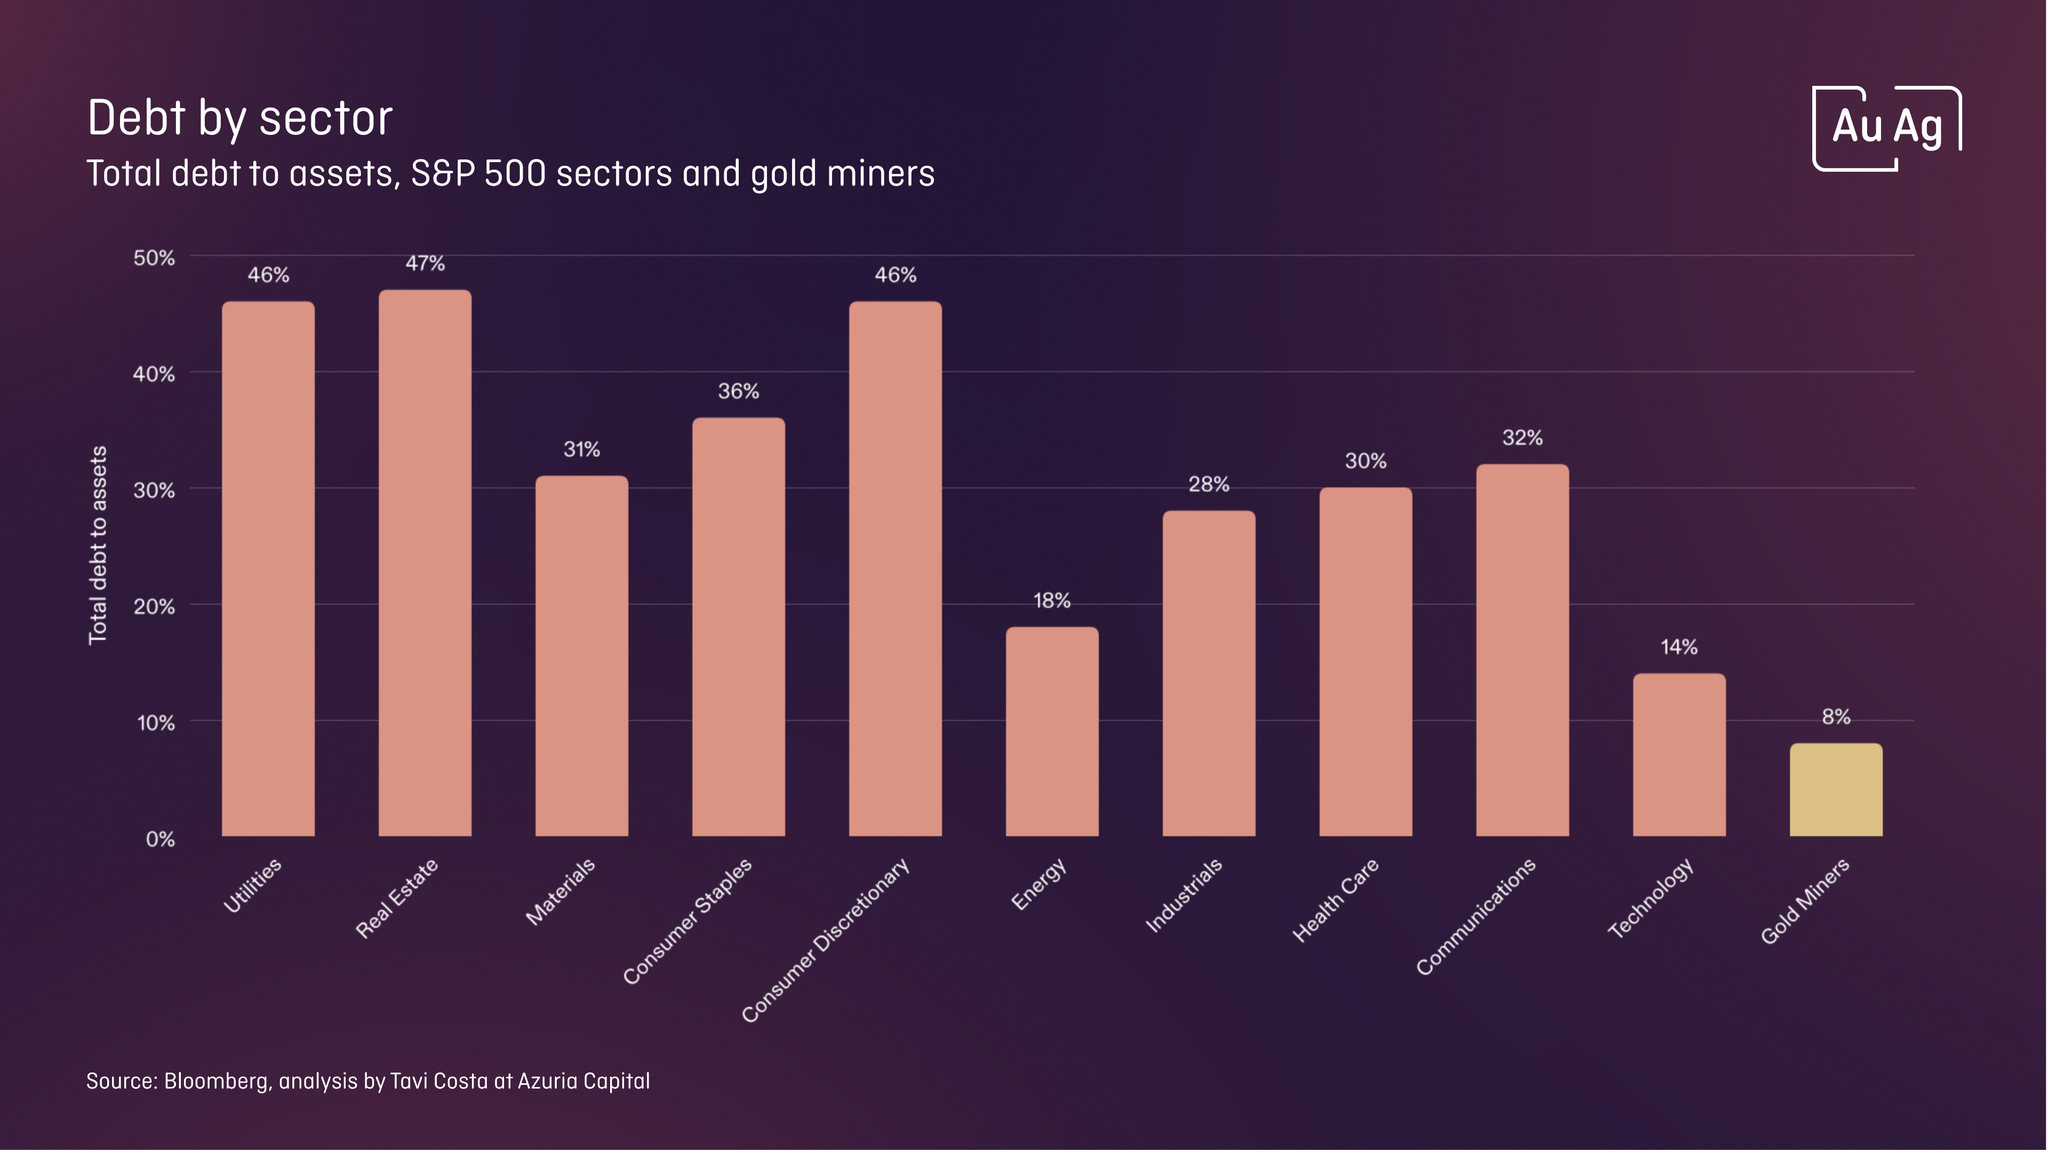
Looking at the companies (their earnings, low debt and buybacks) the picture looks favourable for the mining companies’ share prices going forward.

Bar chart of total debt to assets: S&P 500 sectors up to 47% debt, while gold miners are lowest with 8% debt.

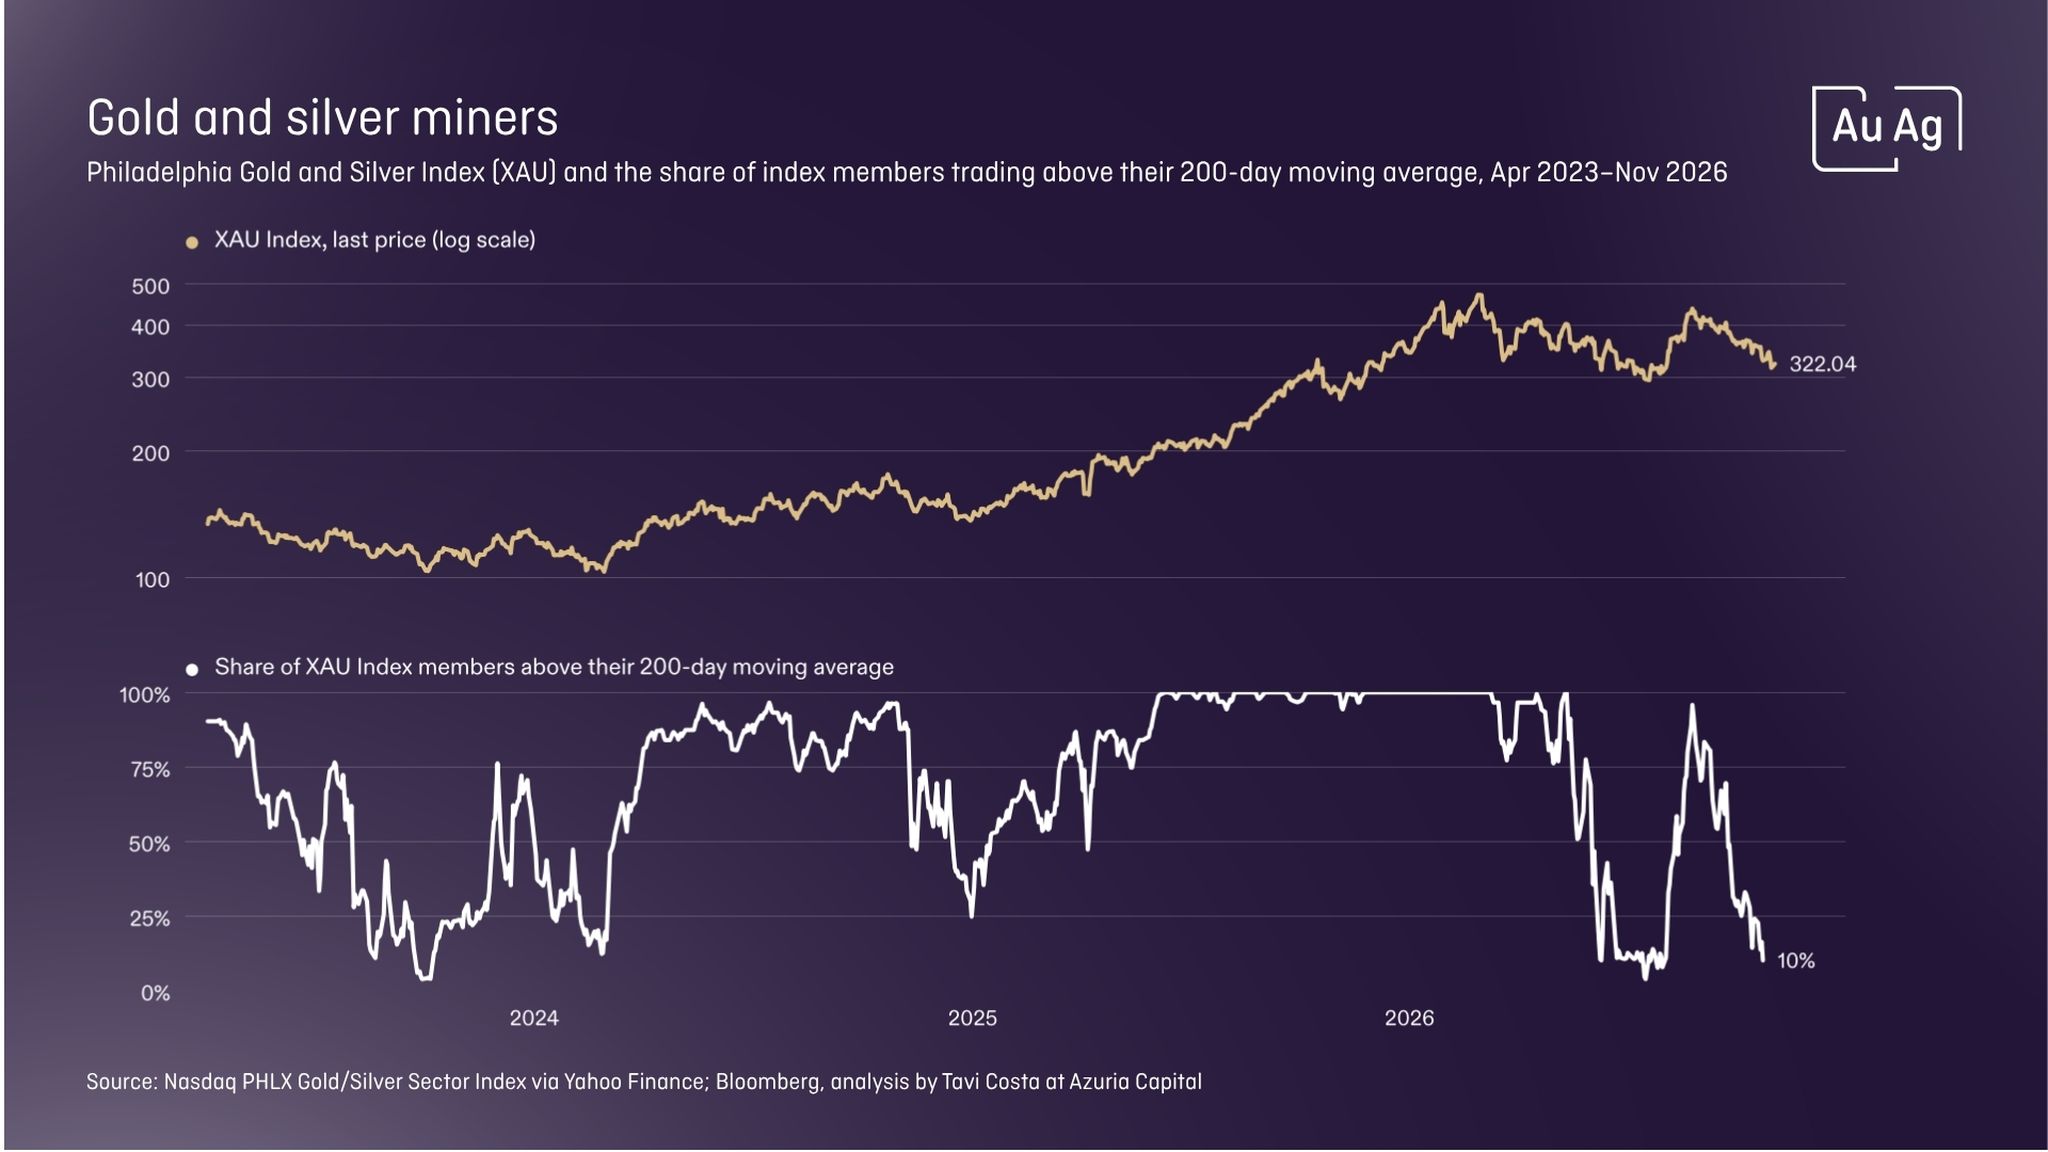
The recent decline has also opened a window for those looking for opportunities. In similar situations in recent years, corrections like this one have proved favourable times to invest or add to existing positions.

Chart of XAU gold and silver miners index rising 2023–2026 while share above 200-day average plunges to about 10% by late 2026.

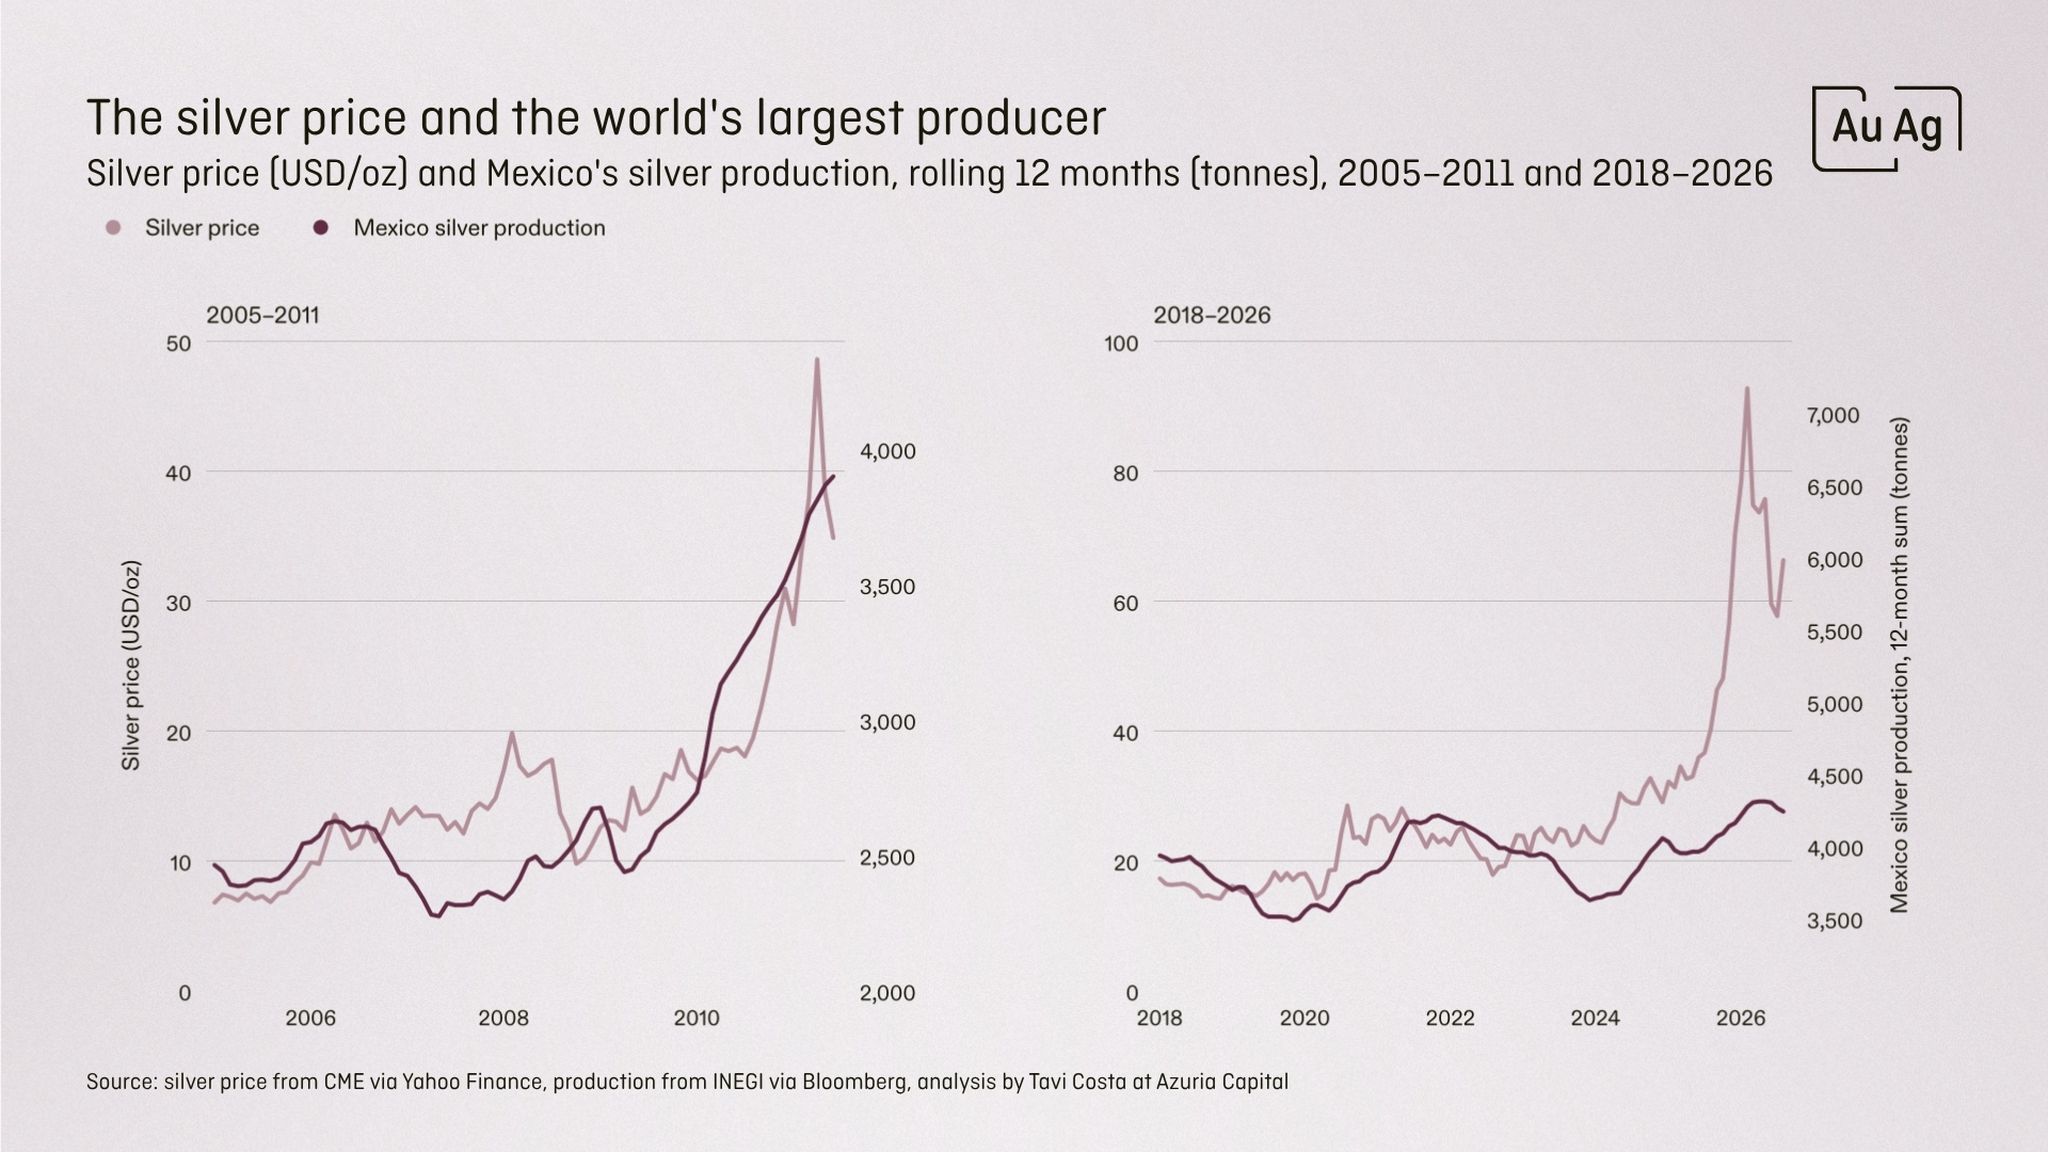
Measuring supply and demand in real time is all but impossible. What we can see now, though, is that production has not kept pace with prices the way it did in previous cycles. We also note that countries are securing access to the essential metals outside the market, and doing so at higher prices than the ones we see on screen.

Dual line charts showing silver price and Mexico’s silver production rising sharply around 2011 and 2025 after years of moderate fluctuations.

Global Outlook with AuAg

There is a great deal of focus on central banks and their upcoming rate hikes, yet no one questions the published inflation figures or sees through them. The real inflation (which we believe is higher than reported) causes the real interest rate to still be negative. Having a negative real rate while communicating a positive one is exactly what central banks want to achieve. 

We also maintain that small 0.25-point hikes are not a serious way to fight real inflation, but rather a play to the gallery. Inflation has been too high throughout, especially over the past six years, and still policymakers say they lack the data to raise rates properly.

The reason is that US debt is so large that meaningful rate hikes aren’t possible, so the aim is to buy time through communication instead. That will work for as long as it works. But we can of course see why there is so much talk.

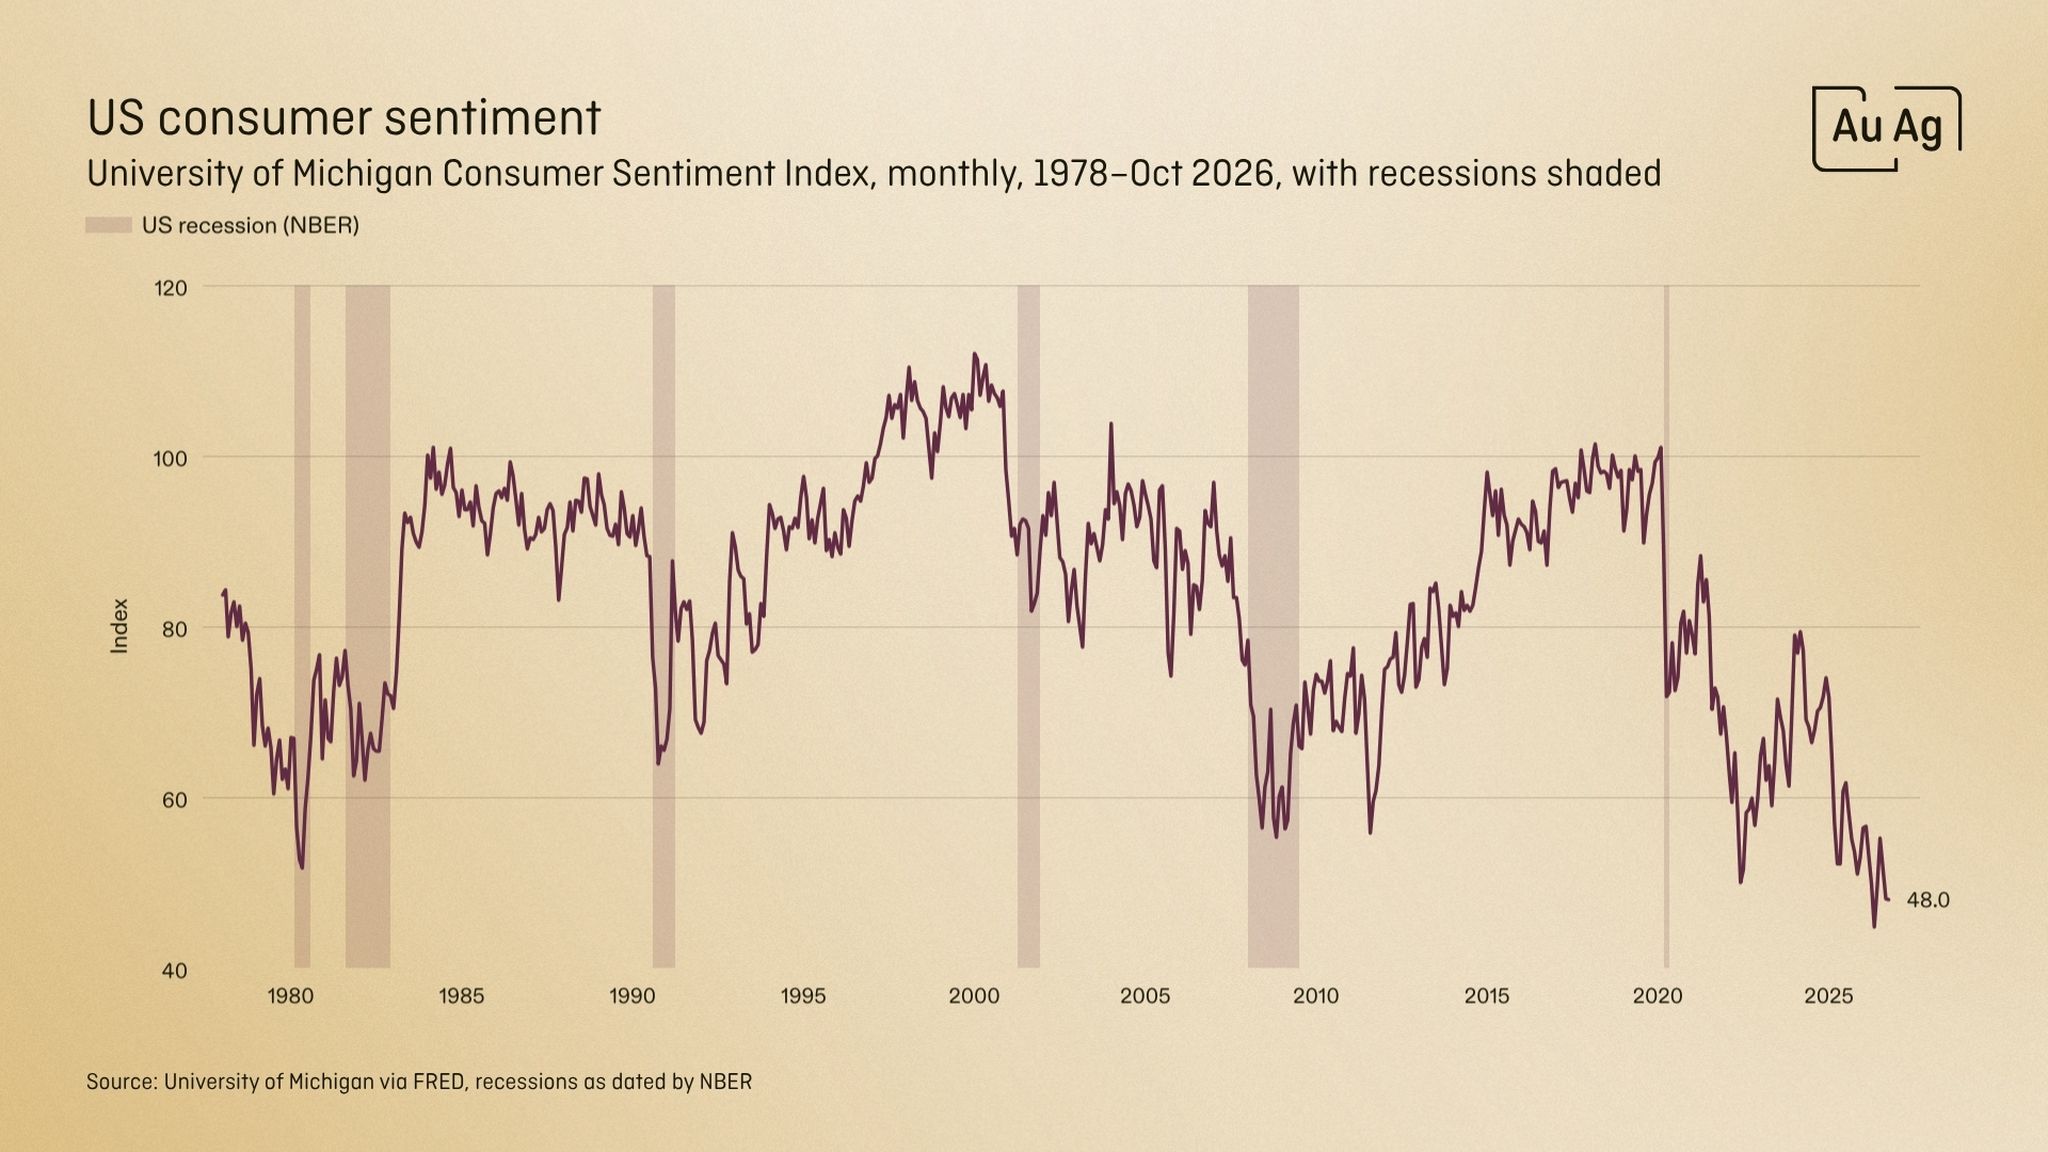
This time, however, the inflation is driven by supply rather than demand, which leaves central banks fighting with blunt instruments. Consumer sentiment is unlikely to withstand much more in costs either, now coming from both high oil prices and higher interest rates.

Line chart of US consumer sentiment index, 1978–Oct 2026, showing peaks near 2000 and steep decline after 2020, with recessions shaded.

To do what was done in the 1980s, the US first needs an economy running at full speed, while accepting higher inflation for a number of years so that debt comes down to 30% of GDP as a result. Then, as Volcker did, it can hike rates sharply to bring down the inflation it allowed in the meantime. 

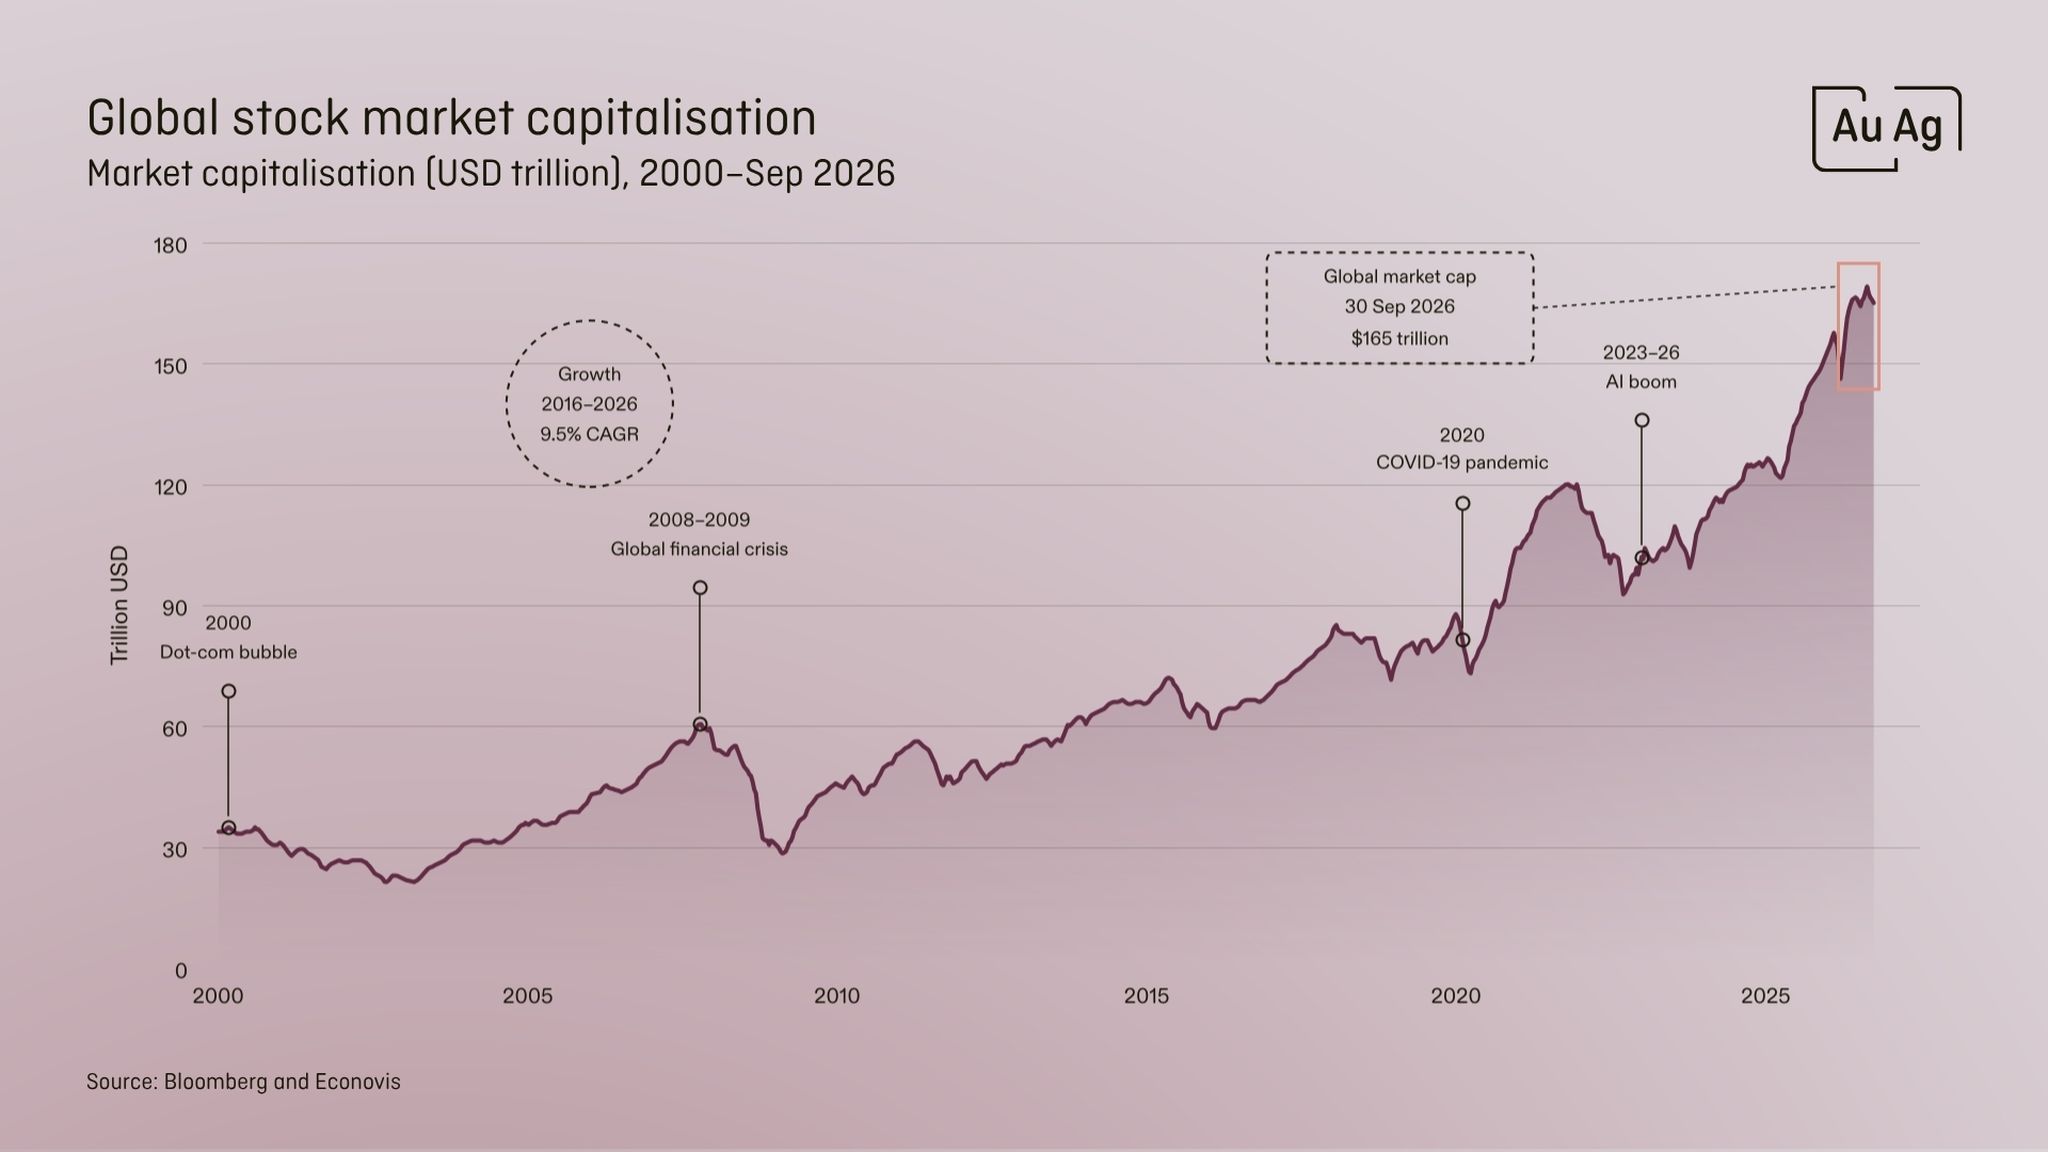
Turning to other kinds of inflation, since the 2008 financial and debt crisis we have seen explosive asset inflation in equities and property. The market value of the global stock market has climbed to worrying heights and is starting to show signs that it struggles to lift itself without more of the enormous growth in the money supply – the “artificial money” – that we've seen since 2008.

Chart of global stock market capitalization from 2000–2026 showing steady long-term rise with dips at crises and forecast peak near $165 trillion.

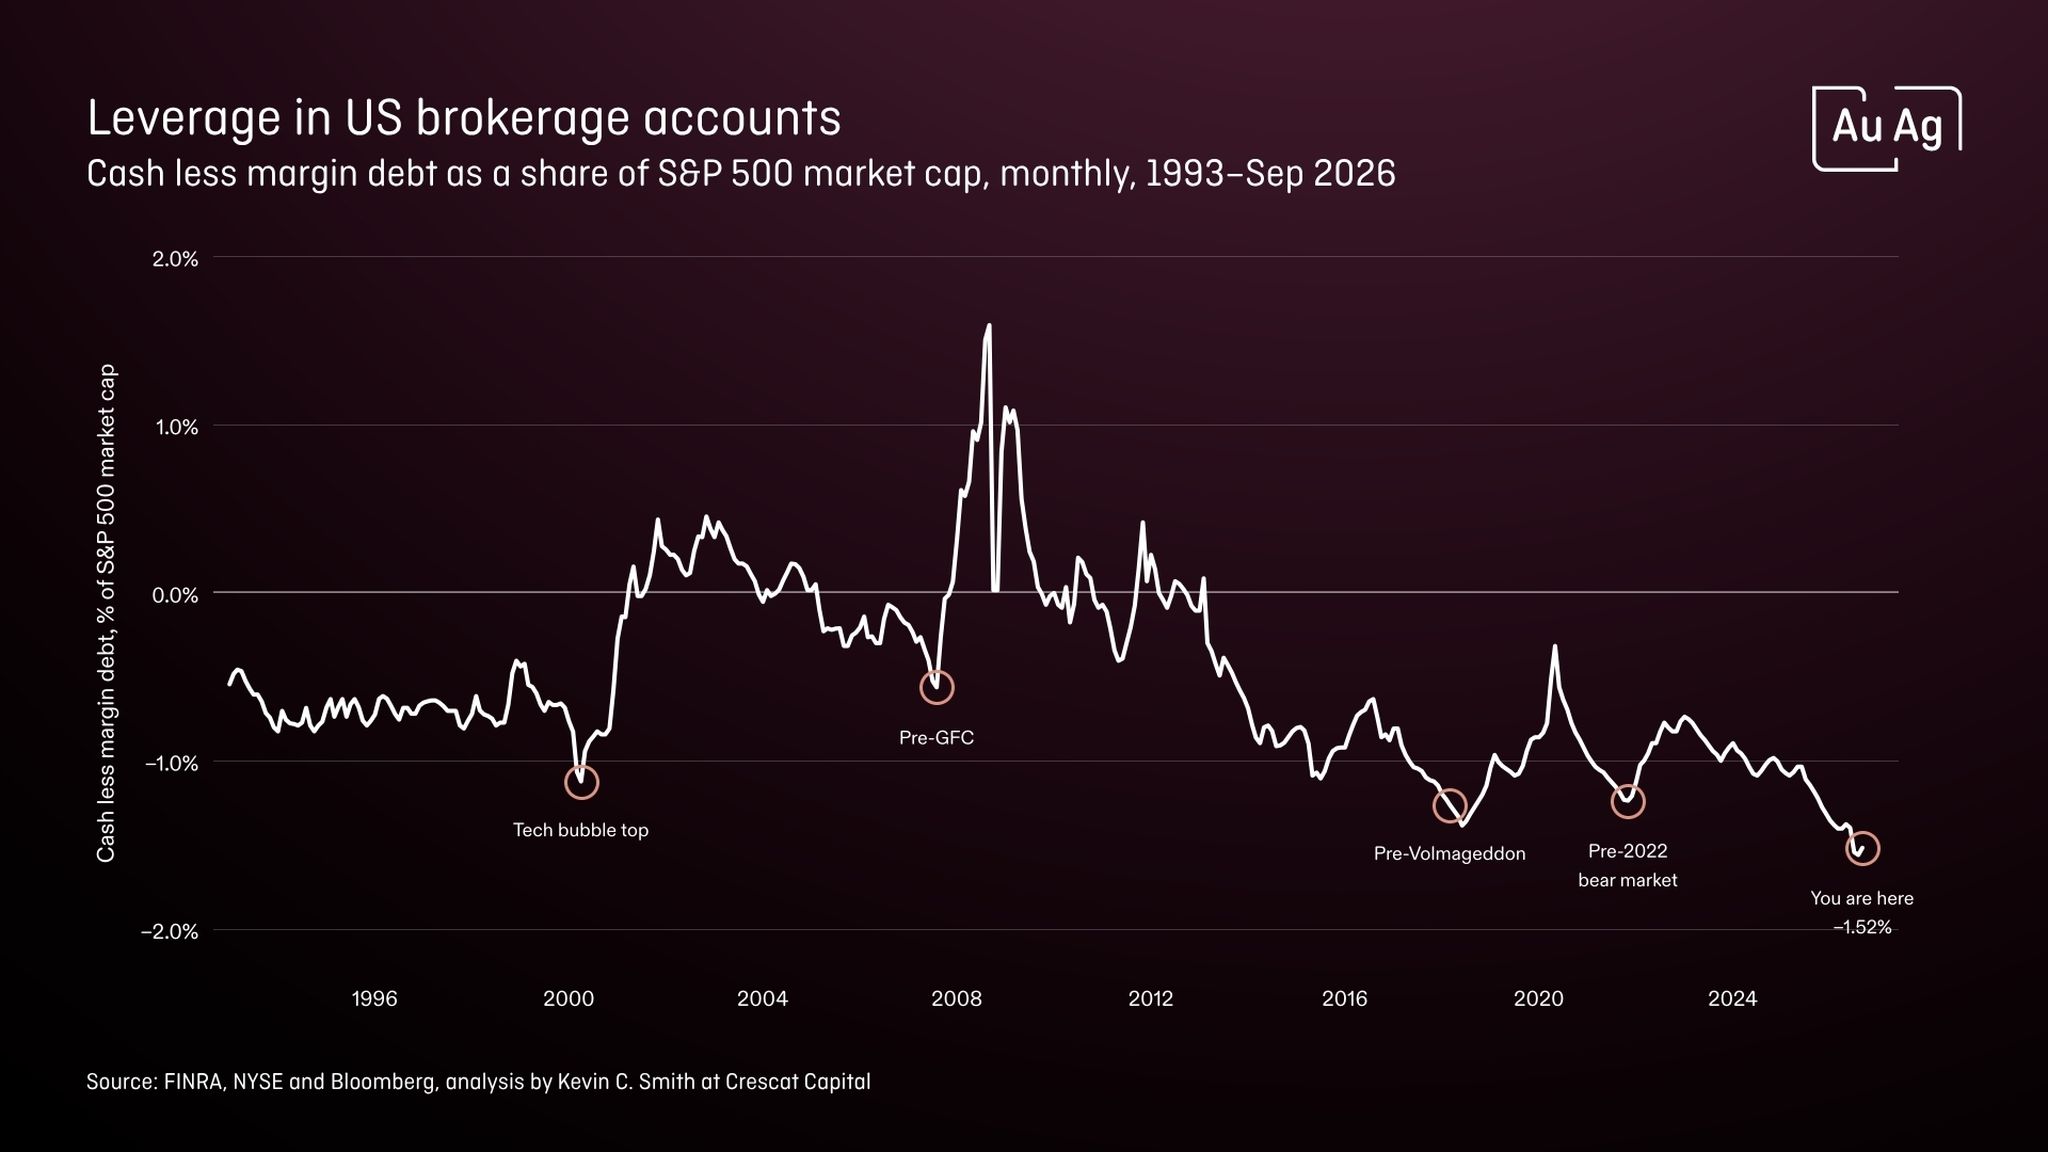
At the same time, we are seeing historic levels in the relationship between cash and margin debt in investors’ brokerage accounts. It now exceeds every previous level that was later followed by major stock market corrections.

Line chart of US brokerage leverage vs S&P 500 cap, 1993–2026, highlighting peaks and troughs with “You are here” at –1.52% in 2026.

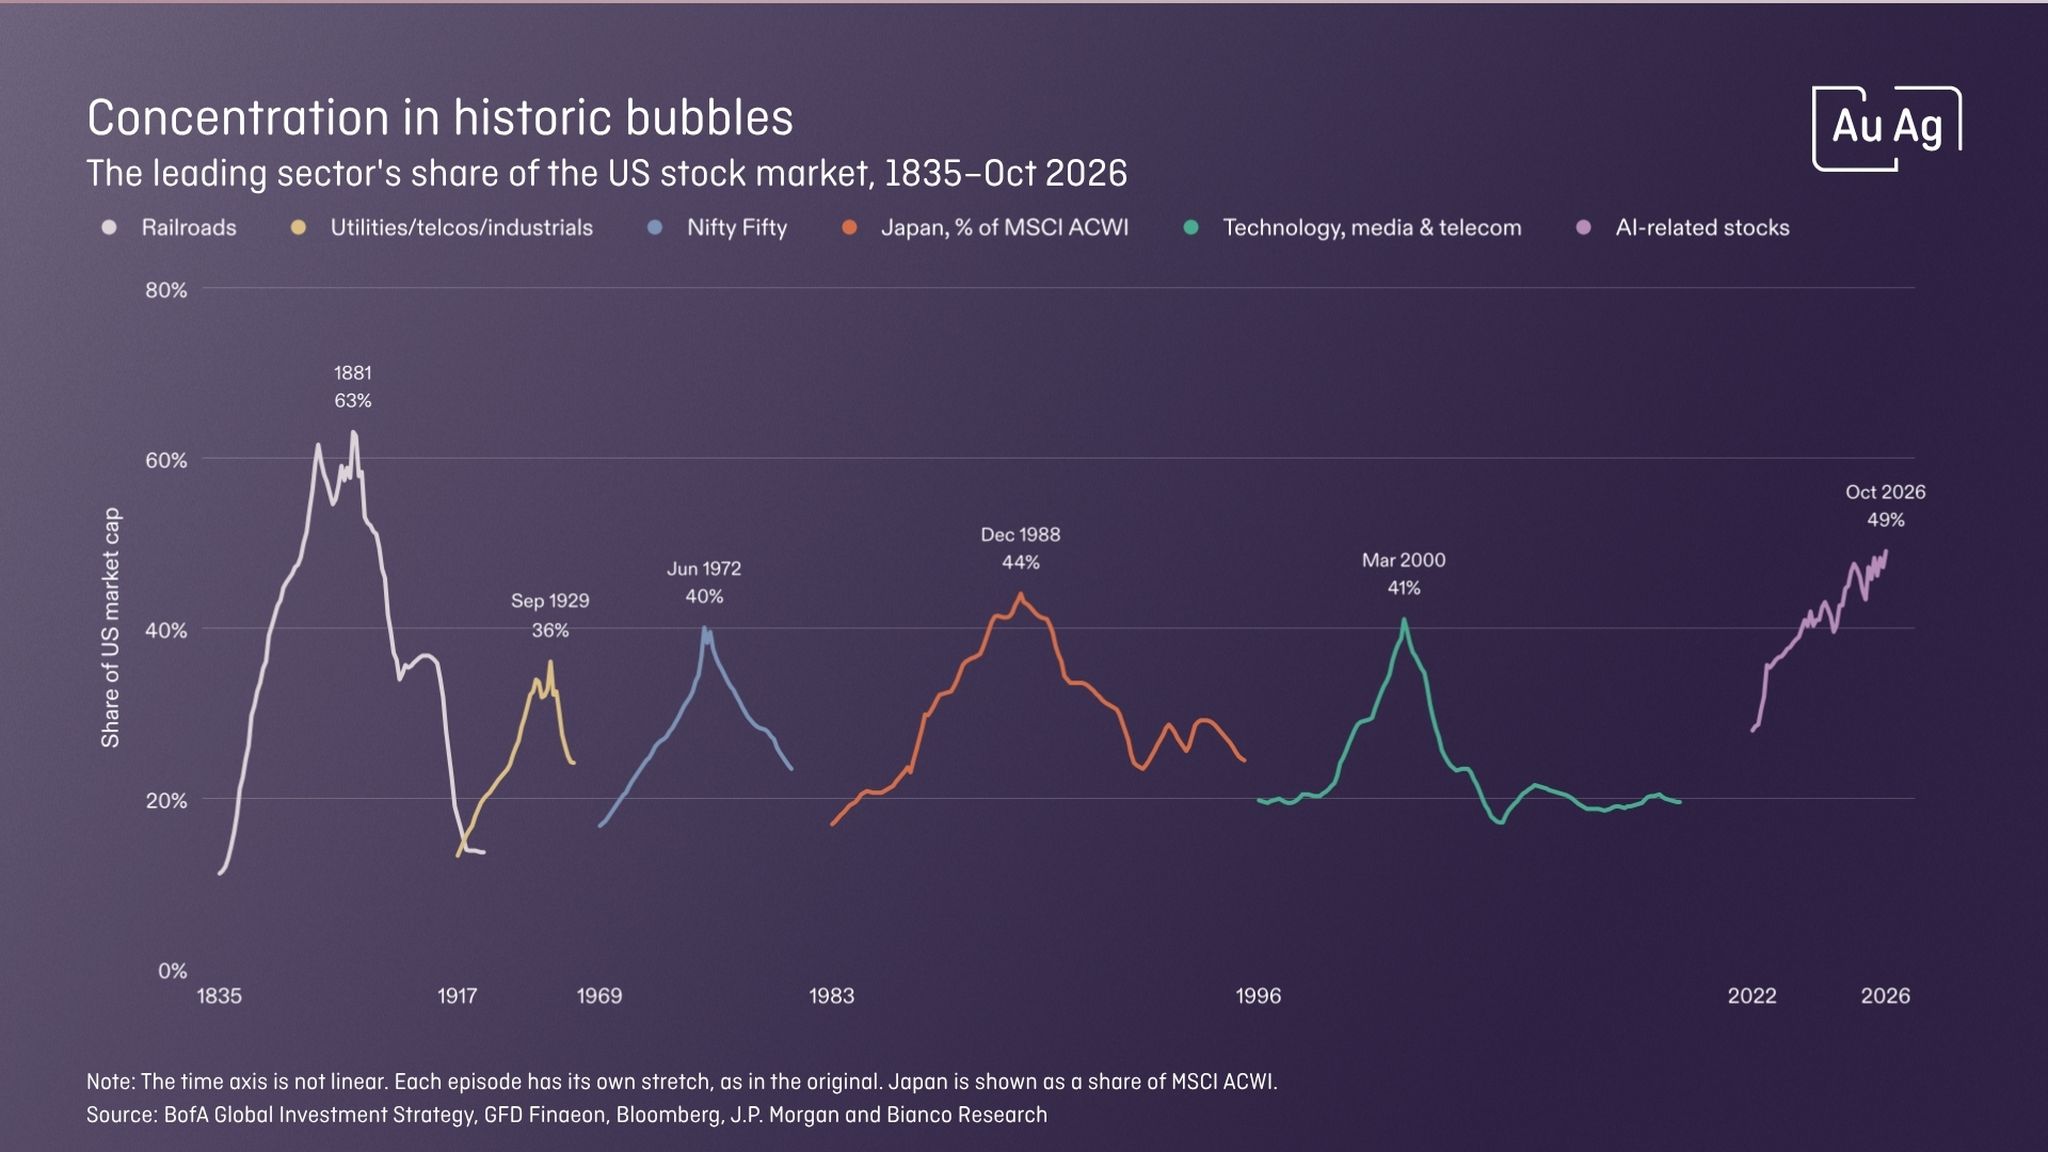
If you are looking for bubbles, one place to look is when certain sectors start to make up a large share of the whole market. Above 40% tends to be the level where you approach something that could make a bubble burst. That we have now seen large tech companies be able to fall 10–25% in a single day is a clear sign of market jitters.

Line chart showing historic sector bubbles and market-cap peaks, ending with AI-related stocks at about 49% share in October 2026.

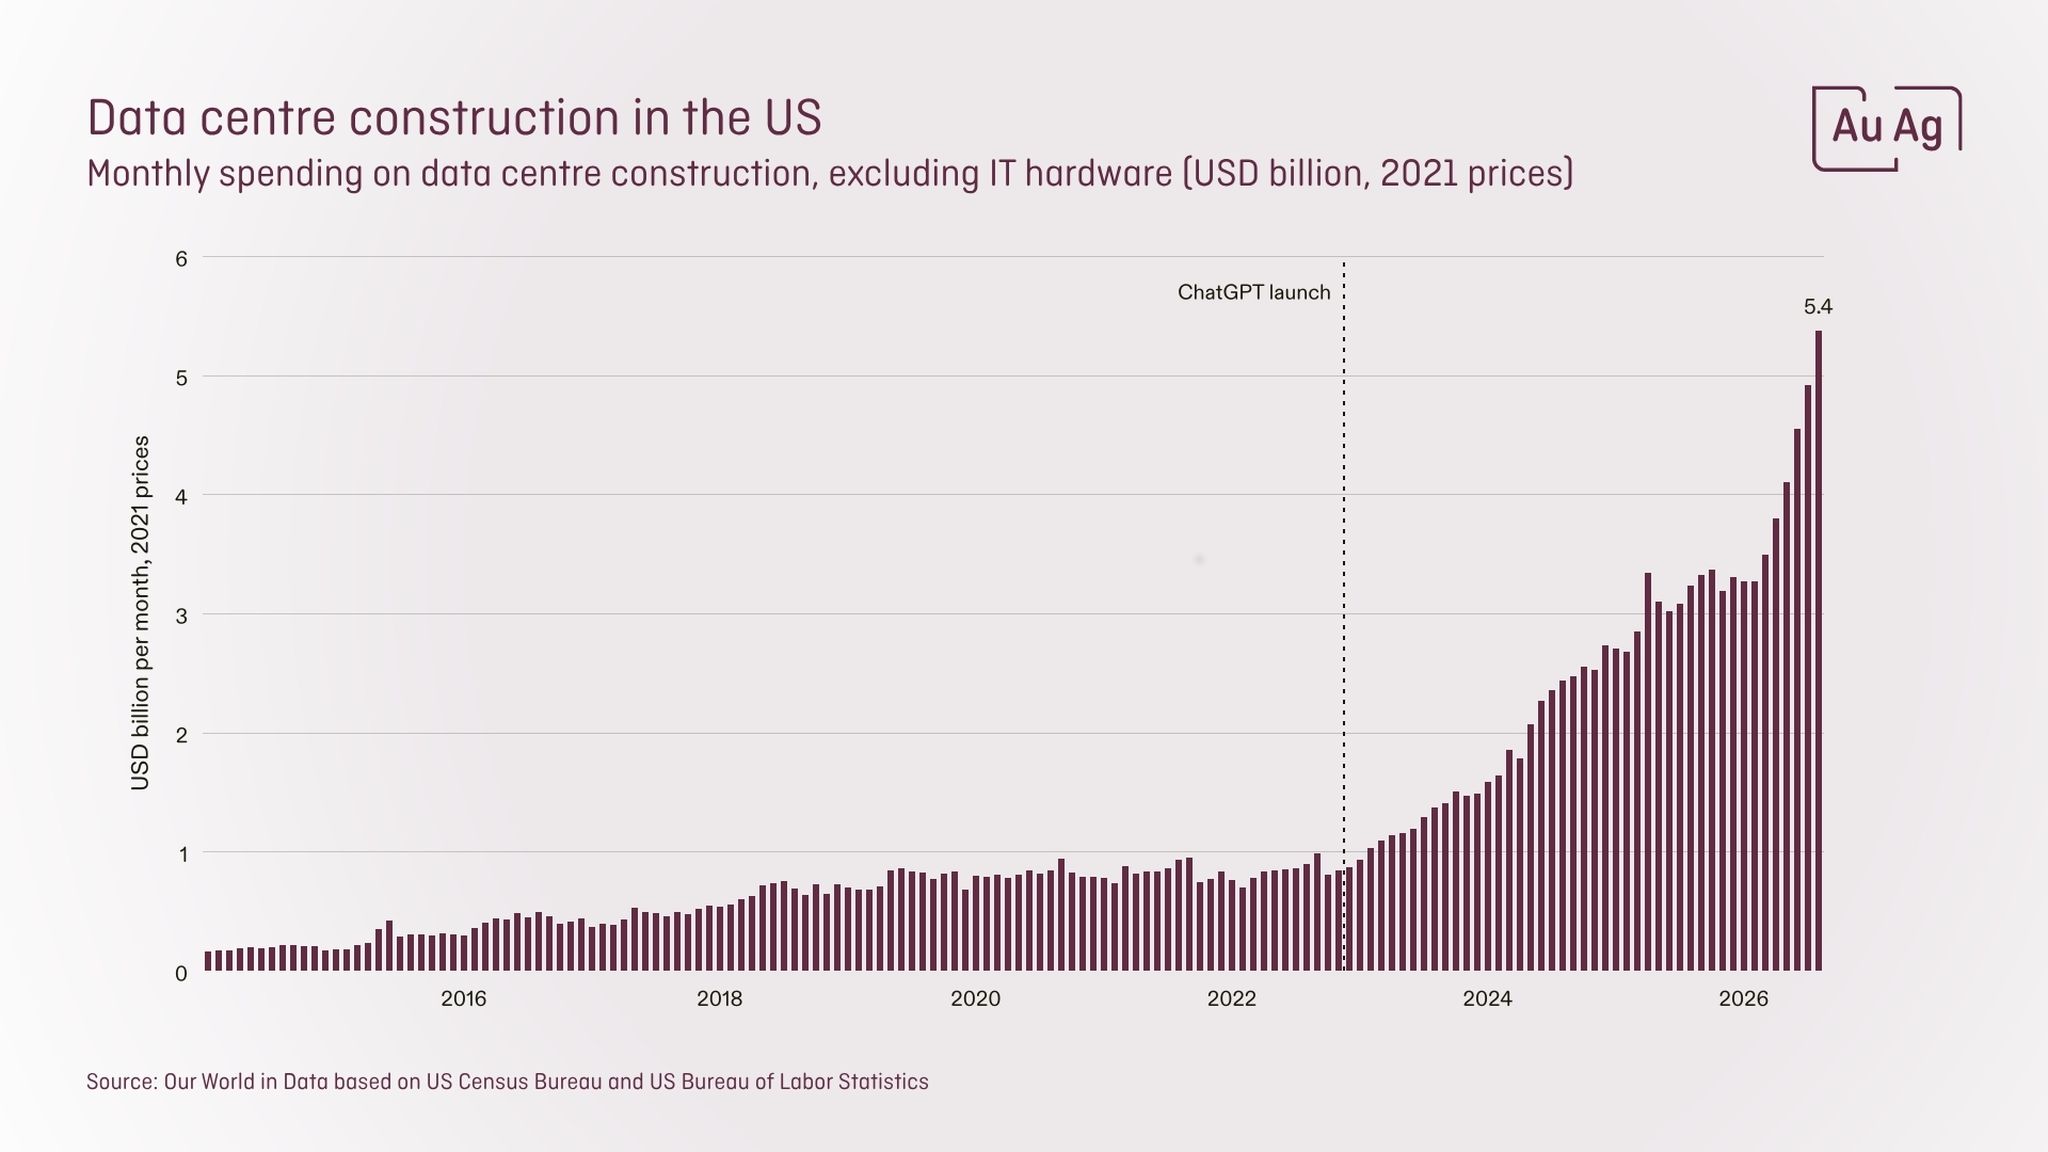
A great deal of money is being spent on data centres. That may be good in one sense, but it may also signal that more “artificial money” will need to be printed to keep “artificial intelligence” flying.

Bar chart showing US monthly data centre construction spending rising sharply after the ChatGPT launch, peaking at $5.4B by 2026.

For us, the effect cuts two ways. First come all the metals needed for this enormous infrastructure push, then the money printing that will mark the start of the dollar’s next -90% leg down. Having fallen 90% twice, a third and a fourth -90% will surely follow. We may then end up with the well-known quote, often attributed to Voltaire: “Paper money eventually returns to its intrinsic value: zero.”

November also brings the result of the US midterm elections. With the Democrats now holding both houses, it will be hard for the sitting president to get his policies through. If this leads to a more peaceful environment, lower oil prices and, with them, lower inflationary pressure, we could see a reversal of the trend that has prevailed since the war broke out. We believe this could have a positive effect on the precious metals market.

We hope to see you in the AuAg Club, on social media, on our website or at any of the events where we appear. If you fancy travelling further, we can meet in London too! 29–30 November, with Eric on stage twice on the Monday!